
Prediction & Tolerance Estimation
“확률과 통계(MATH230)” 수업에서 배운 것과 공부한 것을 정리한 포스트입니다. 전체 포스트는 Probability and Statistics에서 확인하실 수 있습니다 🎲
Interval Estimation 포스트에서 다룬 <Interval Estimation>을 특정 상황에 어떻게 적용할 수 있는지를 다루는 포스트입니다.
Prediction Interval
Supp. the data points $x_1, x_2, \dots, x_n$ are drawn from $N(\mu, \sigma^2)$ with known $\sigma^2$. Now, we draw one more data point $x_0$. Can we estimate where this new data point $x_0$ can be?
Q. Find a confidence interval of the new observation $x_0$ by using data points $x_1, \dots, x_n$.
(가정) Here, assume $X_1, \dots, X_n$ follow iid normal $N(\mu, \sigma^2)$, and the new observation $X_0 \sim N(\mu, \sigma^2)$ and $X_0 \perp X_i$.
먼저, 우리는 아래와 같은 분포를 생각해볼 수 있다.
\[(X_0 - \bar{X}) \; \sim \; N \left(0, \; \sigma^2 + \frac{\sigma^2}{n} \right)\]위의 분포를 바탕으로 Confidence Interval을 구하면,
\[\begin{aligned} 1 - \alpha &= P \left(-z_{\alpha/2} \le \frac{X_0 - \bar{x}}{\sqrt{\sigma^2 + \frac{\sigma^2}{n}}} \le z_{\alpha/2} \right) \\ &= P \left(\bar{x} - z_{\alpha/2} \cdot \sqrt{\sigma^2 + \frac{\sigma^2}{n}} \le X_0 \le \bar{x} + z_{\alpha/2} \cdot \sqrt{\sigma^2 + \frac{\sigma^2}{n}} \right) \end{aligned}\]💥 만약 $\sigma^2$을 모른다면, 위의 식에서 $z_{\alpha/2}$ 부분을 $t_{\alpha/2}$로 바꿔주면 된다!!
Tolerance Interval
<Prediction Interval>에서는 “the next observation”이라는 single observation에 관심을 가졌다. 반면에, 때로는 population의 값을 얼마나 커버하는지 그 bound를 구해야 할 때도 있다. <Tolerance Interval> 또는 <Tolerance Limits>는 이런 bound를 estimation하는 과정을 말한다!
Now, our interest is the proportion of the distribution where is the large bulk of our distribution.
Q. Let $X \sim N(\mu, \sigma^2)$, can you find interval which contains 95% of the population distribution?
[$\mu$ and $\sigma^2$ both are known]
\[\mu \pm 1.96 \sigma\]위의 범위는 ‘정확히’ population distribution의 95%를 커버한다! 우리는 이것을 <Tolerance Interval>이라고 부른다!!
[$\mu$ and $\sigma^2$ both are unknown]
대부분의 경우, 두 파라미터 $\mu$, $\sigma^2$에 대한 모른다. 이 경우, 우리는 sample mean $\bar{x}$, sample variance $s^2$를 사용해 아래와 같이 interval을 만들 수 밖에 없다.
\[\bar{x} \pm k s\]위의 interval을 구성하는 녀석이 모두 RV이기 때문에, 위의 interval 역시 RV이며 population distribution을 커버하는 비율(proportion) 역시 정확히 결정되지 않는다. 우리의 목표는 위의 sample parameter에서 추정한 위의 interval을 구하는 것이며, $\bar{x} \pm k s$을 <Tolerance Limits>라고 한다!
<Tolerance Limits>를 구하기 위해 2가지 값을 결정해야 한다.
1. population distribution을 얼마나 cover하는 interval을 추정할 것인지: $1 - \alpha$
이것은 $\bar{x} \pm k s$가 얼만큼의 distribution을 커버하는지 결정한다. 예를 들어, $\alpha=0.05$라면, 우리는 $\bar{x} \pm k s$가 population distribution의 95%를 커버한다고 말할 것이다.
2. interval의 신뢰도: $1 - \gamma$
이것은 RV인 $\bar{x} \pm k s$의 신뢰도를 제시한다. 샘플링을 반복할 때마다 $\bar{x}$, $s^2$는 늘 변할 것이고, 따라서 우리가 구한 $\bar{x} \pm k s$는 정확한 값이 아니라 RV이다. 그래서 제시한 $\bar{x} \pm k s$가 얼만큼의 신뢰도를 가지는지 제시해야 한다. 만약 $\gamma=0.05$라면, 우리는 $\bar{x} \pm k s$가 95%의 신뢰도를 가진다고 말할 것이다.
수식으로 표현해보면 아래와 같다.
$L(X_1, \dots, X_n)$, $U(X_1, \dots, X_n)$를 각각 <Tolerance Limits>의 양끝 bound라고 해보자. 둘은 RV이다.
우리는 $L(X_1, \dots, X_n)$ and $U(X_1, \dots, X_n)$ s.t. $(L, U)$ contains $95\% = (1-\alpha)\%$ of population with $100(1-\gamma)\%$ confidence라는 두 <statistics>를 추정해줘야 한다!! 😲
\[P \left( F(U) - F(L) \ge 0.95 \right) = 1 - \gamma\]where $F$ is the CDF of $N(0, 1)$.
결국 <Tolerance Limits>를 추정하기 위해 우리가 구해야 할 것은 $k$이다. 이 값은 <Tolerance Table>을 통해 구하면 된다. 아래는 테이블의 예시다.
값은 아래의 3가지 파라미터로 구하면 된다.
- Confidence Level of interval: $1-\gamma$
- Percent Coverage: $1-\alpha$
- sample size: $n$
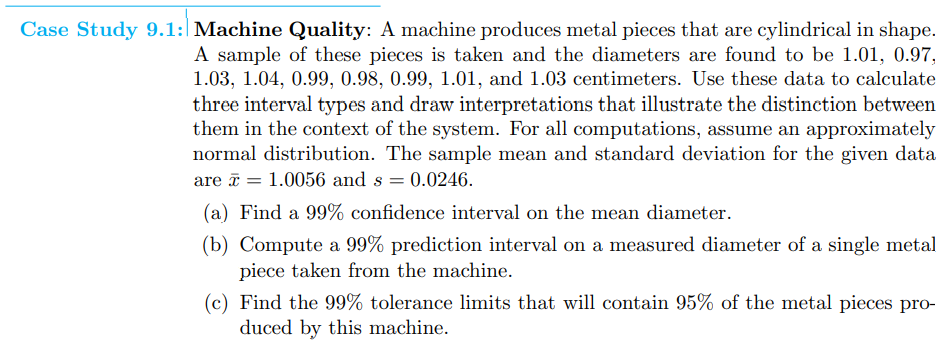
예제를 통해 <Confidence Interval>과 <Prediction Interval>, <Tolerance Interval>와 그 차이를 익혀보자.
이어지는 포스트에서는 “두 가지 샘플”이 존재하는 Two Samples 상황을 다룬다. 주로 두 샘플의 평균의 차 $(\mu_1 - \mu_2)$를 추정하거나, 두 샘플의 분산의 비율 $\sigma_1^2 / \sigma_2^2$을 추정한다.
- Two Samples Estimation: Diff btw two means
- Two Samples Estimation: Paired Observations
- Variance Estimation
- Single Sample
- Two Samples